The cause of a stumble, stall or misfire code could be part of a more significant issue due to the overall condition of the engine. A great diagnostician can understand what happens in the 0.2 second or less when the compression stroke transitions to the power stroke. This part of the cycle is when the mixture of air and fuel ignites and how the flame front spreads in the cylinder. A great technician with a scope will be able to say, “That doesn’t look right.”
Air and Fuel
Air enters the air filter housing and is measured by a mass airflow sensor. Or, some engines have the contents estimated by a MAP sensor and air temperature sensor. The air is then directed into the intake manifold. The length of the runner and flaps at the port can smooth out the flow and take advantage of the opening and closing of the intake valves to increase the amount of air that flows into the cylinder.
The intake runners on some engines can be optimized for throttle angle and engine speed. The air will then enter the combustion chamber around the intake valves with the slightest turbulence possible.
Fuel injection refinements have focused on droplet size and ensuring the volume is correct for the combustion event. It started with sequential fuel injection in the 1980s, and the ultimate improvement has been direct fuel injection during the past decade.
The volume of fuel is critical to the stoichiometry of the combustion event. Too much fuel, and the event is too rich. Too little fuel, and the event is too lean. If the droplets are too big, all of the fuel might not burn. If the droplets are too tiny or vaporize, the flame front might not ignite predictably.
Spark Science
The space between a spark plug’s electrodes are not empty. Between the two points of precious metals are air and fuel. This mixture will determine the behavior of the spark.
Imagine you are a spark plug. You are in the cylinder, and the piston is traveling downward, pulling in air through the intake valve. The intake valve closes, and the piston starts going upward to compress the air before the piston reaches top-dead-center. The fuel injector squirts as if it is a direct-injection engine.
The density of the air and fuel has changed since being compressed into the pocket between the crown of the piston and the pocket of the cylinder head. The cylinder has gone from 15 psi at atmosphere to more than 200 psi. As a result, the density of the air and fuel has changed, affecting how the spark jumps between the electrodes.
When the potential difference between the electrodes exceeds the breakdown voltage of the air and fuel mixture, the spark can occur. The best way to understand breakdown voltage is to think of the air and fuel mixture as a resistor between the spark plugs electrodes. The resistance changes as the mixture is compressed.
A lean air/fuel ratio will take more energy to fire the spark plug. A rich air/fuel ratio will require less energy to fire the spark plug. This is because air is the best resistor or insulator between the spark plug’s electrodes. If droplets of fuel are in the air, it lowers the energy required to make a spark between the electrodes.
As the secondary of the coil discharges, the voltage will spike and then drop to the holding current level as the fuel and air inside the cylinder is burned and the piston travels downward. The most important concept to understand is that the air and fuel act as a resistor or a potentiometer that changes the resistance as the mixture is compressed and burned. Lean mixtures have more resistance, and rich mixtures have less resistance.
Why do I need to know this?
How can it make me money?
Most engine diagnostics comes down to the two milliseconds when the piston travels upward, the spark plug fires close to top-dead-center, and the piston travels downward as the flame front expands during the power stroke.
For example, think about the ramps before the intake ports on a VW FSI engine, or the anti-tumble valves on a Toyota AR-series engine. When these items fail, it generates a code because the characteristics of the air entering the combustion change can cause issues with the airflow, depending on engine speed.
If the spark plug gap has grown due to erosion of the electrodes, the additional air and fuel in the gap require more current and voltage to start the spark. Issues with the fuel, air and emissions can be diagnosed if you understand what is happening in the gap when the piston is getting close to top dead center.
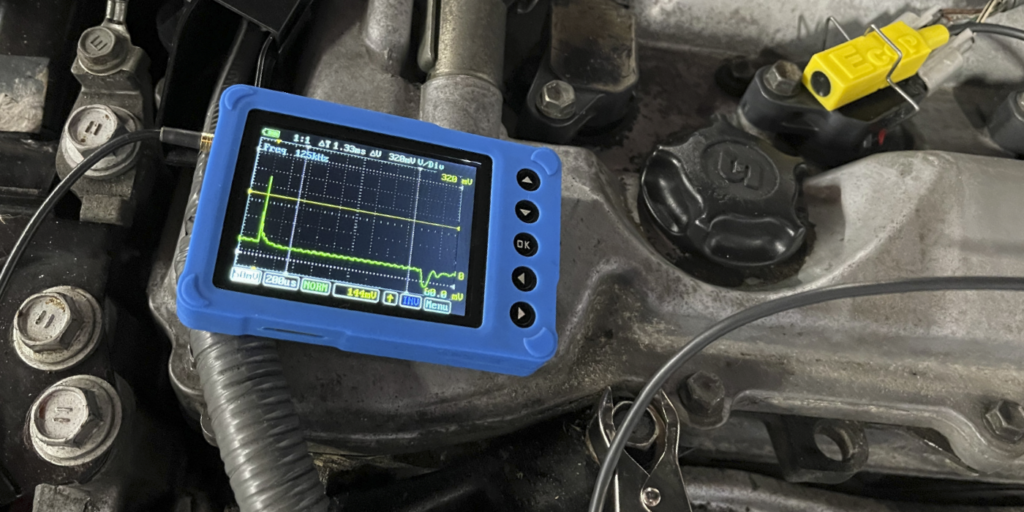
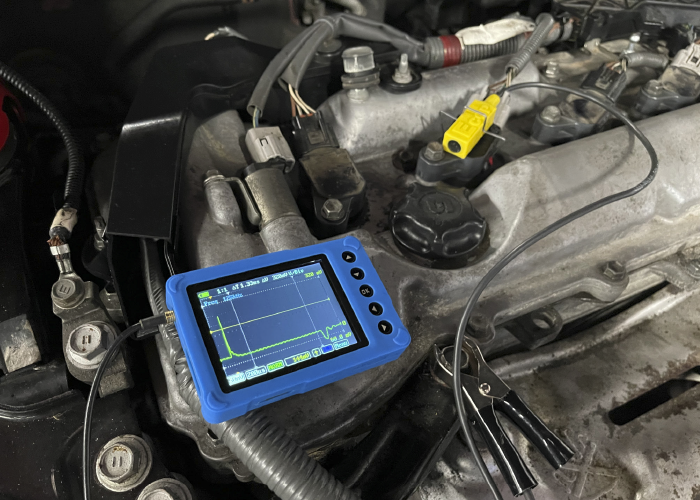
How can you see the flame front or the gap between the electrodes of the spark plug? The tool is a scope and knowing how to interpret the secondary ignition waveform.
History
The grandfather of all waveforms is the secondary ignition waveform. Technicians have been looking at this waveform since the 1950s to determine the health of the engine. The secret to capturing and analyzing secondary ignition waveforms is understanding what is happening in the coil and at the spark plug, and how the scope measures and graphs the voltages and ignition events.
Old-school technicians could do this with a refrigerator-sized engine analyzer. First, they would connect an inductive clamp over the wire coming from the ignition coil that leads to the distributor. Next, they would connect an inductive lead to the number one spark plug. Finally, the technician would adjust the scale, time and trigger to get all cylinders displayed on the screen. They would call this the “parade.”
A healthy engine would have all the very similar peaks and valleys. The technician would open the throttle to see if the peaks all matched and did not go too high or too low. Even Stephen and Steady Eddie were the fundamental marchers in the parade.
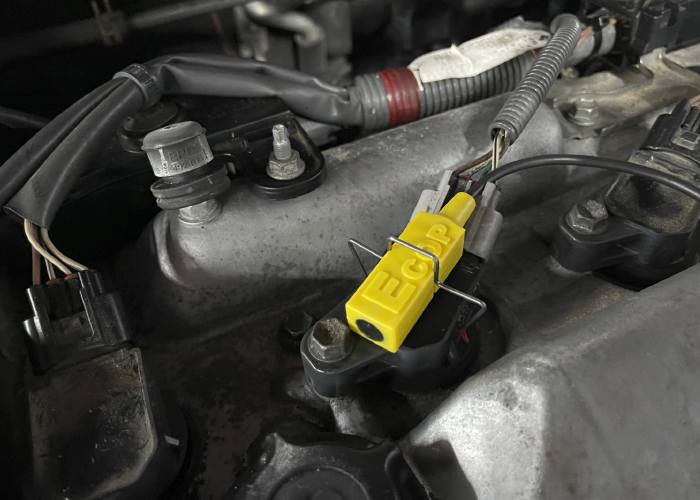
Most technicians didn’t understand the nuances of the waveform, but some could spot mechanical problems like a burned valve or a carburetor that was out of tune. Measuring the voltage of the secondary ignition directly is not an option; these high voltages will damage any scope or meter. A capacitive probe is required to capture a secondary ignition waveform. This type of probe can be either the traditional clamp over an ignition wire or a “paddle” that makes contact with the coil’s surface or ignition wire.
The primary and secondary windings of the coil transform the energy from low-voltage/high-current energy to high-voltage/low-current energy. The flow of energy changes the magnetic field in the wires or coil. This change in the field is picked up in millivolts by the clamp or paddle probe.
Paddle probes have a conversion factor of 10:1. This means that 1 volt at the scope input equals 1,000 volts or one kilovolt (kV) in the secondary. Some clamps or probes may have an attenuator (10:1 or 20:1). Make sure you read the instructions to properly set up your scope. Some scopes will convert the voltage scale to kV when the ignition probe is selected.
A capacitive probe should have a ground clamp as part of the test leads. This creates an easier path to ground for the thousands of volts generated by the coil. If the probe or clamp is not grounded, the voltage could damage the internal circuitry of the scope. Most scopes have a limit of around 200 volts, and most ignition systems can generate more than 4,000 volts.
What are the settings for the scope?
When you are trying to set up a scope to measure secondary ignition waveforms, the goal is to capture the ignition event from when power is applied to the coil to the point where the coil oscillates with the remaining energy. This can occur in 6-10 milliseconds. One millisecond per division is typically the optimal time base, depending on the size of your screen and the type of ignition system.
A healthy coil and ignition system generates 3-4 kV at idle. As load and engine speed increase, the kV spike will increase. Some systems can create more than 30 kV under certain lean conditions. You may need to adjust your voltage scales to capture the total output of the spike.
On most scopes, the trigger should be set to auto or single with an increasing slope. With some scopes, you will use an auto or repeat trigger setting to stabilize the waveform. There are also options to offset or delay the trigger to fit the entire event on one screen.
What are the sections of the waveform?
A secondary ignition waveform can be broken down into three parts. First, the area of the waveform that shows dwell where the coil’s secondary is saturated with energy from the primary. Second, the spike that indicates the initial start of the spark between the electrodes or the breakdown voltage. Third, the burn time that is the area of the wave where the spark is burning between the electrodes and eventually stops.
Saturation/Dwell
The first part of the waveform is the charging of the secondary coil by the primary. This is where the energy of the primary saturates the secondary coil. There will be an initial sharp voltage drop followed by a sine wave that is a coil oscillation. This oscillation is the module turning on power to the coil. As the secondary becomes saturated, the line will slowly go up in a steady ramp. The critical shape of this part of the waveform should be a smooth upward ramp. It can change due to demands on the engine.

The Spike
The spike is where the coil discharges, and the spark jumps from one electrode to the other. This spike changes depending on the resistance between the electrodes when it hits the breakdown voltage. The resistance depends on what is taking place inside the combustion chamber.
As cylinder pressure increases and the fuel mixture changes, the energy required to fire the plugs increases. This is why the spike should increase in height if you snap the throttle.
If the sparkline does not increase when the throttle is snapped or is lower when compared to the other coils, it is a sign the spark might be escaping to areas other than the spark plug electrodes. A shorted connector or boot could cause this with an air gap. The spike stays the same height because the conditions around the short do not change with engine rpm.
There are no specifications for the spike, but it should look like a single line on most scopes. After the spike has dropped, you should see small decreasing oscillations.
The key with the spike is to compare it to the other coils on the vehicle. If one spike goes higher than the rest, it is a sign of two things. First, the resistance in the combustion chamber could be different than the rest of the cylinders, or the spark plug could be worn. Second, if the spike is significantly lower than the rest of the cylinders, it is a sign that the resistance is lower in the plug or cylinder. In some cases, a clogged or dead fuel injector can cause a lower spike when the throttle is snapped.
The Burn
The burn line is the burn time of the spark between the electrodes. It will typically last 2 to 3 milliseconds. The “perfect” burn line should be a constant decreasing slope at idle. The line can have slight changes and can appear jagged on some scopes. This has been theorized as changes in the gases and turbulence in the cylinder.
At the end of the burn line are the coil oscillations. This is leftover energy in the coil. It should have three or four smooth humps. If it has a spike and a short burn time, it is a sign there is an open in the wire or boot, preventing the energy from going to the plug. Points systems have a more fluid line, and coil over plug is more abrupt.
If the burn line is low compared to the other cylinders, the cylinder could be running too rich. If the burn line is high, does not slope downward and is shorter than normal, the combustion event is lean. If a cylinder is running very lean, it might have a spike at the end. This is because the energy remained in the coil instead of being used to form the spark.
Interpreting Secondary Ignition WaveForms
On modern coil over plug (COP) or wasted spark systems, you are using the secondary waveform as a comparative tool. You can compare a waveform to a known-good pattern from a database or compare the waveform to the other cylinders. Waveforms will differ from engine to engine.