Article courtesy Transmission Digest magazine.
One of my jobs at Certified Transmission is to assist with R&D on the vehicle side of things, whether it is for new unit development or for an existing application that we already build as a part of our continuous improvement initiative. I gather real-world driving data from a vehicle we purchase for the purpose and this data is then used for developing dyno department testing routines, specifications for the solenoid department, or for the needs of our technical director responsible for the unit in testing. This article is not going to be about a case study or a problem vehicle that we found an unusual issue on, but more about sharing information and specifications that we found that might not be found within typical information sources.
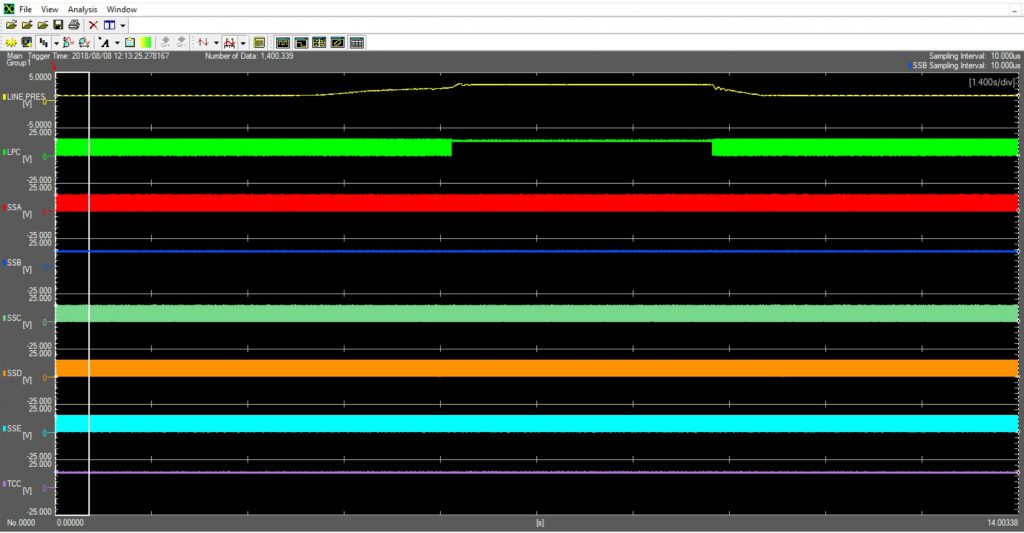
Several months ago, we were working on the 6R140 for the HD applications and doing some pressure testing and gathering a general collection of data to ascertain specific control strategy for this transmission. Aside from a scan tool that we can use to look at data, we also have a very expensive scope that we can record up to 10 channels at a very fast sample rate. The sampling interval on the following example is 10us or 10 microseconds (which equates to 100k samples per second), and we can record for about 60 seconds with no buffering. Also, in addition to looking at solenoid control, we can use Pico® pressure transducers to record pressure information as we did on this example. (Figure 1)
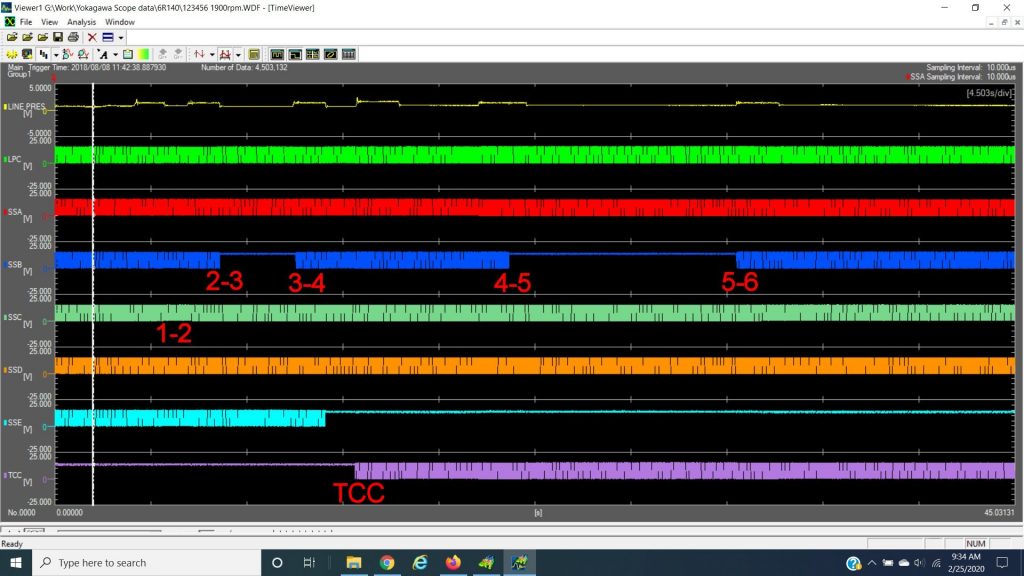
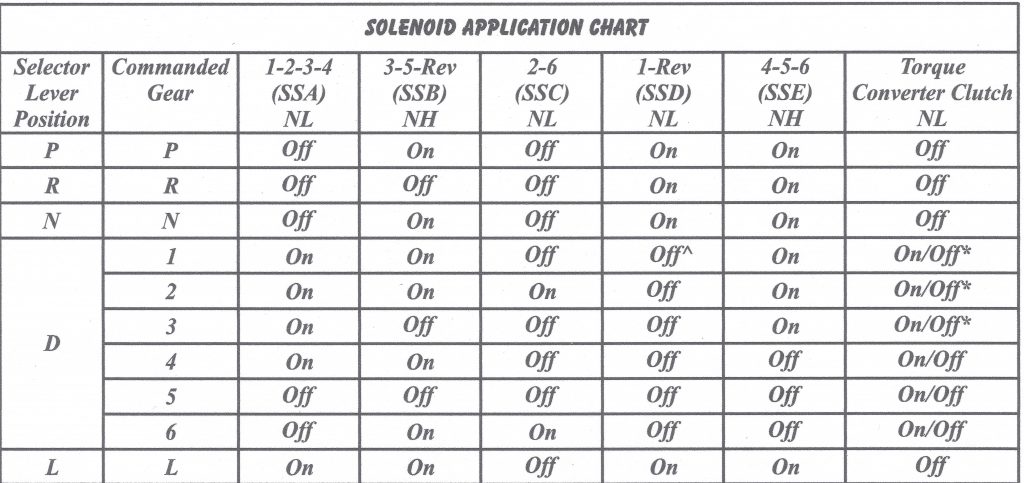
This is a “zoomed out” recording of a 0-70mph run where the transmission shifted through all six gears. The data is as follows: Ch1. yellow, actual line pressure. Ch2. green, line pressure control. Ch3. red, SSA. Ch4. blue, SSB. Ch5. light blue, SSC. Ch6. orange, SSD. Ch7. teal, SSE. Ch8. purple, TCC. Here is the solenoid application chart from ATSG for reference. (Figure 2)
While it is easy to see almost all the gear changes just by the activity of SSB as it cycles on and off for every change except the 1-2, how does it change from first to second gear? You surely cannot see anything else changing from this view; the only thing that happens on the 1-2 shift is SSC (the 2-6 solenoid) turns on. This is a NL (normally low) solenoid, so to see what happens during the shift we really need to have a closer look at the signal while zoomed in. (Figure 3)
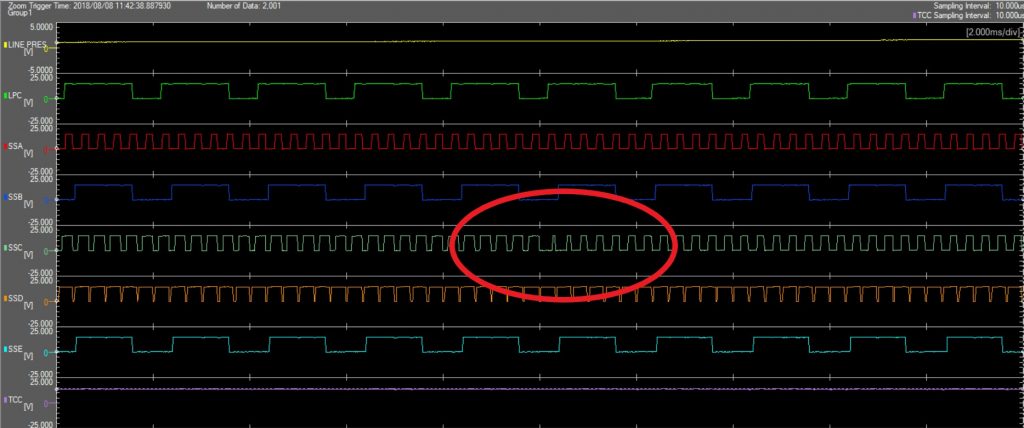
This single action is all that happens in order to make the 1-2 shift. SSC ramps from 15% to 35%, then to 85%, and then ramps down to 55%. The three NL shift solenoids (SSA, SSC, and SSD) in this unit are never electrically off, but hydraulically they are off at 20% – duty and below, and they are on from 28-85% with most of the time spent between 30-44% duty cycle. However, the NL TCC and both the NH (normally high) shift solenoids will turn off electrically. The other event that is not easy to see happens on the 4-5 shift with SSA, and that solenoid is on for gears 1-4 and turns off in 5th and 6th. There is no good way to visually illustrate this, but in 1st through 4th gears SSA is on at about 56% duty cycle, and around one second before the 4-5 shift completes by SSB turning off, SSA starts ramping down from 56% to 10%. The takeaway with this is that you really need to use a scope if you are trying to look at any type of solenoid activity; a DVOM is just not practical to use on an application like this.
The other thing you might notice from Figure 1 is the line pressure. The top line is a direct voltage reading from a Pico® WPS500X pressure transducer. During each shift transition (and when TCC applies), you can see a jump in the line pressure. This recording is just a normal acceleration event from 1st to 6th gear. The shifts completed at about 2000 RPM with line pressure at 100-105 PSI, and during each shift the line pressure jumped up to 140 PSI. When TCC applied, it changed to 167 PSI. When we talk about shift adapts this is the area where you are going to see a change in these pressures. These changes in pressure are not going to be the same from one unit to another. For example, on a high-mileage unit you will undoubtedly see these pressures raise higher than this, whereas on a fresh remanufactured unit, a unit where there were modifications made to the VB, or even a unit utilizing a more aggressive clutch material, you could possibly see the pressure go down during a shift transition rather than up like what we saw here.
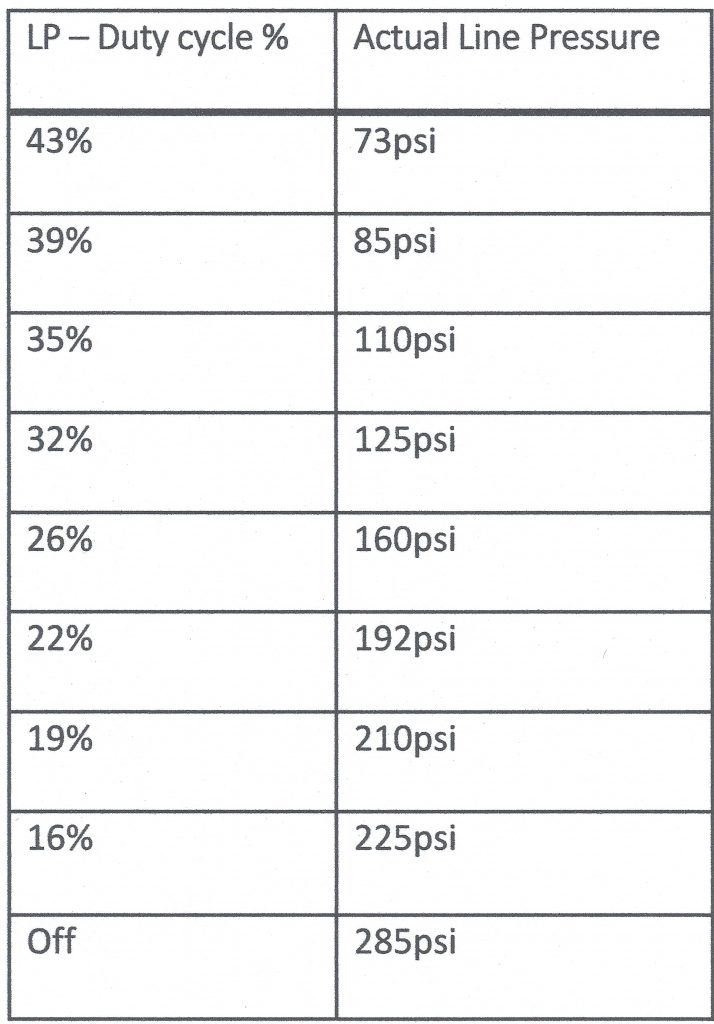
The TCC solenoid when activated changes from 85% to 55% to 40% in about two seconds and will fluctuate depending on load anywhere between 10% to 55%. The only time you will ever reach the maximum line pressure is while performing a reverse stall test. (Figure 4)
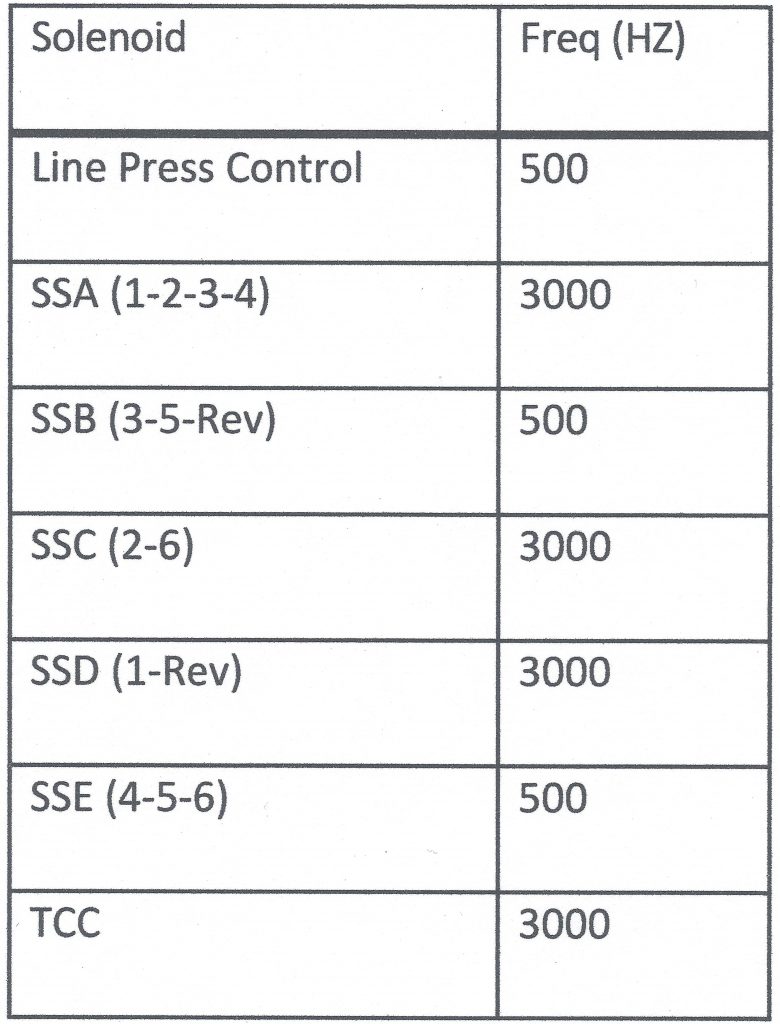
As you can see, the line pressure solenoid turns off and line pressure shoots to 285 PSI. For more reference material, look at Figure 5 for line pressure vs duty cycle, and Figure 6 lists all solenoids and the frequencies that they operate at.
Hopefully, this article has provided more insight to the control aspect of these modern transmissions. While we use this data in order to fine-tune our dyno testing and help improve our products, it can also be used for diagnostic purposes in the field. As the controls become more precise in nature, scoping equipment becomes a necessity in any shop that is working on late model vehicles.
Chris Adams started with Certified Transmission in 1986 as an R&R technician, and currently works as our Diagnostic Trainer. His current duties involve training and advising our retail diagnosticians, as well as assisting in the research and development of our remanufactured products. He holds ASE Master and L1 certifications.
-Article courtesy of our sister publication, Transmission Digest.